Evolution of the Density Field
Volume rendering of a turbulent and cold ISM region (with an isothermal equation of state) without self-gravity. The turbulence is driven by a random solenoidal force at large scale (visualization by Tim Sandstrom, NASA/Ames).
Rotation and Zoom in
Evolution with Self-Gravity

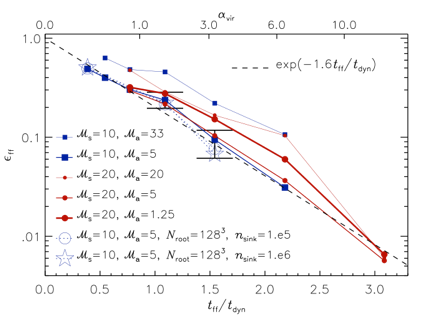
SFR per free-fall time, εff , versus tff /tdyn. The symbols for each series of runs, where only the strength of gravity is changed and Ms and Ma are kept constant, are connected by a line, to better distinguish each series. The two error bars give the mean of εff, plus and minus the rms values, for each group of five 323-root-grid runs with identical parameters (Ms ≈ 10 and Ma ≈ 5), but different initial conditions. The dashed line is an approximate exponential fit to the minimum value of εff versus tff/tdyn.

SFR per free-fall time versus effective virial parameter for a subset of the clouds selected from a 250 pc SN-driven simulation, harboring more than 100 sink particles (filled circles). The model prediction, SFRff,MHD, for each cloud is also shown (empty squared symbols). The deviations from the model predictions are on average less than 50%.