How to analyze grids
This is GRIDCOR's main menu:
When no grid file has been created or loaded, the button 3.- Statistical analysis is disabled. To analyze an existing grid, you need to load it first with 2.- Load/Modify data file.
How to create a new grid file
To create a new grid file, click on 1.- New data file.
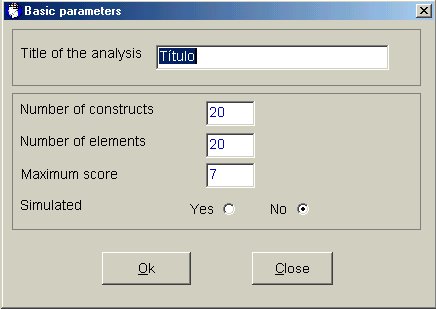
Grid file Parameters
This window will immediately appear:

Entering the data
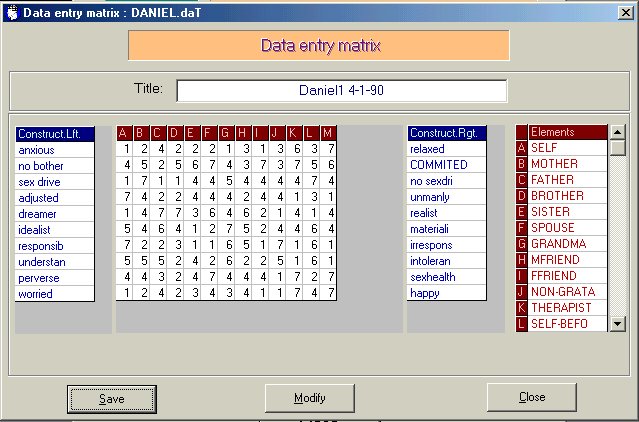
This is GRIDCOR's data entry matrix:

On the first line is the name you gave to the analysis. Next there is the grid data matrix itself, with the labels of the left poles of the constructs at the left of the data cells, and the right ones at the right. To each column belongs a letter, which appears again at the right of the window with the labels of the elements.
|
Warning: the "self" must be the first element (letter A), and the "ideal self" the last; otherwise, the cognitive measures involving these figures will be wrong. |
If you have not chosen to get a simulated data matrix, the cells for the data and labels are empty.
You may move around the screen in the usual way (with tab and cursor keys, etc), and fill the cells just like any worksheet application. With "RETURN/INTRO" at the end of each line of the data matrix, the cursor will move to the beginning of the next.
The constructs and elements labels may have up to nine characters, so it may be neccesary to condense the original labels.
|
Warning:
it becomes imppossible to make the proper statistical analysis, and GRIDCOR halts with an error message. It is a good idea to ensure, before entering the data, that no element or construct has monotonous scores and that there are not two identical elements or constructs. In that case, you must not enter the monotonous construct or element, or at least one of the constructs or elements which are identical. |
|
Hint: It is a good idea to write the construct labels in small letters and the element labels in capital leters, in order to distinguish them better on the printed output. |
Saving the data
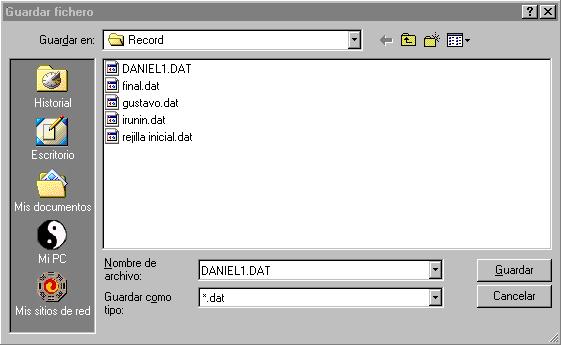
Once you have finished entering the data, you must save them into a data file before starting the analysis. Clicking on Guardar will display this window (it may be different according to your operative system):

Now you must enter the name for the data file. When you click on Guardar, GRIDCOR adds to this name the extension ".dat" (for "GRIDCOR data file"), closes the window and returns to the data matrix screen.
|
Warning: on some computers, it is neccesary to save all data files (*.dat) in the very same folder whete the application is located (C:\Program files\Gridcor); otherwise, GRIDCOR may pop up an error message. |
| The grid data file"*.DAT" |
GRIDCOR saves its data on ASCII (DOS text files). These files may be
opened and edited with any word processor. You don't need to open "*.dat"
files to analyze grids; but it may be useful to do it, for instance, to
directly copy the scores to another text, or to change them without using
GRIDCOR's data entry menu. You have to save the file in the same ASCII
format. |
If you want to change the parameters of the analysis, (number of constructos and/or elements, maximum scale range, title) click on Modificar.
To start the analysis, click on Cerrar.