HOW TO USE GRIDCOR v. 4.0 (7)

Interactive displays

Some of GRIDCOR's dialog boxes allow you to choose the kind of data to display, print or save.

Dual diagrams

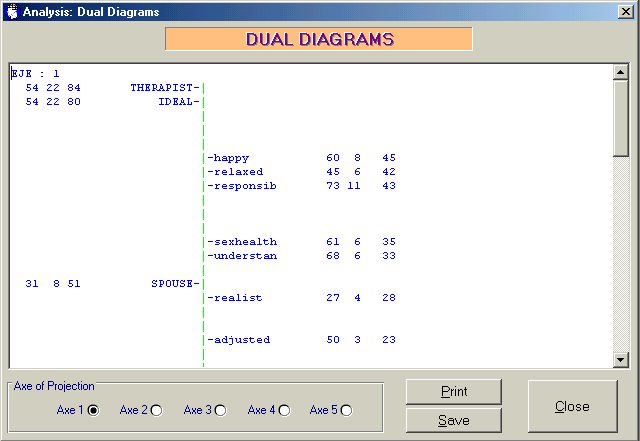
The 3.- Dual Diagrams button displays this window:

You may select the axe (factor) to plot by activating its radio button. Once you have made a selection, you may save the graphic into a file (with the *.sim extension) or print it.

You may also paste the axe into a word processor file following the same procedure as with the Printing results menu. First, select the results to copy, placing the cursor over them and moving the mouse while pressing the left button; then, press the [Control] and [c] keys. Now, open the word processor and place the cursor where you want to introduce the results, and press [Control] and [v].

By clicking on Close you can return to the results menu.

Plotting axes

The 4.- Plotting of axes button displays this window:
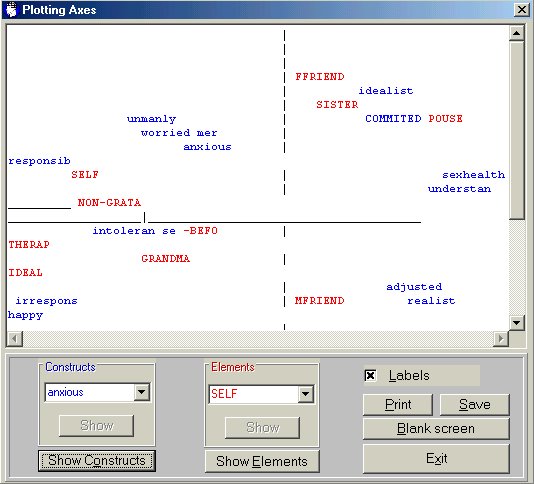
Here you can look at the joint plot of the first two axes (factors), with the constructs in blue and the elements in red. This display may be modified in several ways.
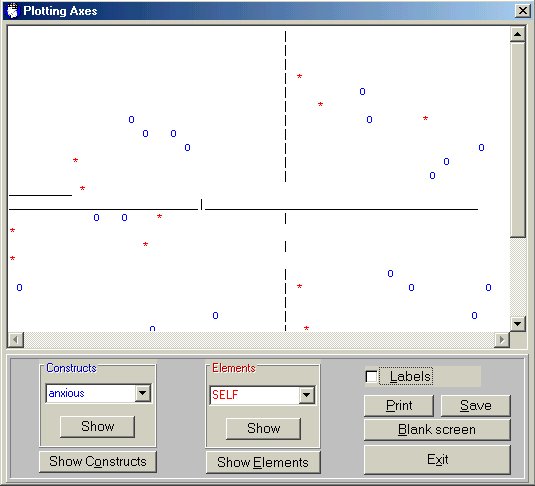
  1. If the Labels checkbox is activated (as above), you will see the labels of the constructs and elements; otherwise, you will only see its locations. The blue "0" are the constructs, the red "*" the elements:

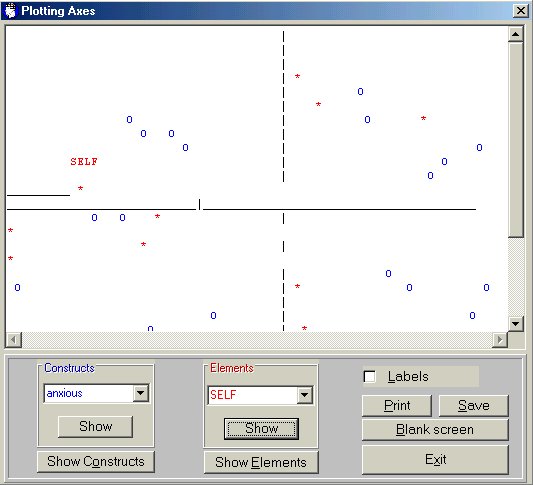
  1. When the Labels checkbox is not checked, you may display separately each element and/or construct with the Show buttons. Just choose from the appropriate drop-down menu the construct (left menu, in blue) or element (right menu, in red) the display and then click on Show. The label of the construct or element will appear; in the example below, the SELF element (upper left part of the screen):

All constructs and elements may be displayed, one by one, this way.
  1. The Show Constructs and Show Elements buttons display all the construct or element labels.
  2. The Blank screen button cleans the screen leaving only the crossing axes:

  1. The Save button saves a file with the particular plotting of axes you have created. This file has always the same name, EJES.SIM, and is always saved where the grid data file (*.dat) is.
  2. The Print button sends the graph to the printer.
  3. To return to the previous menu, click on Exit.