Description
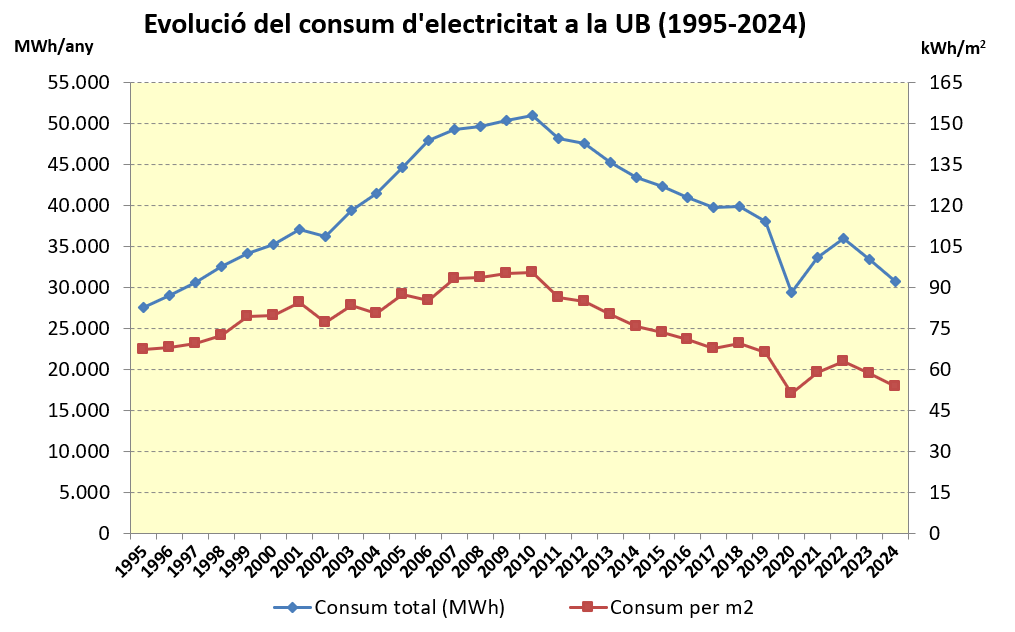
Amount of electricity consumed in the buildings of the University of Barcelona in different uses (lighting, operation of electrical and electronic devices, air conditioning, etc.)
| Indicator | 2020 | 2021 | 2022 | 2023 | 2023 | Evolution |
|---|---|---|---|---|---|---|
| Total UB consumption (MWh) | 29.454 | 33.681 | 36.015 | 33.453 | 30.795 | |
| Consumption per unit area (kWh/m²) | 51,4 | 59,1 | 63,1 | 58,6 | 53,8 |
Results
Electricity consumption increased by 84% for the UB as a whole between 1995 and 2010, while the increase in the same period was 40% per m2 of built area. This growing trend reflects both the increased use of energy in air conditioning (especially the increase in air conditioning systems in summer) and laboratory machinery or electronic devices, and the increase in built area with the sum of the buildings of at the UB.
From 2010 onwards, there was a change in trend due to the buildings being closed during holiday periods, the awareness of the university community, greater control of the air conditioning systems and the implementation of heating and cooling measures. Thus, between 2010 and 2019 consumption will decrease by 25.4% in total, and by 33.1% per m² of built surface area.
The figures for 2020 and 2021 reflect the lower attendance due to the COVID-19 pandemic, and the years 2023 and 2024 show a further reduction thanks to the energy saving measures implemented within the framework of the Plan to promote energy saving at the University of Barcelona, including the communication campaign ‘We are responsible’. Thus, electricity consumption between 2022 and 2024 will fall by 14.5%.
More information available in the news about energy and water consumption .