By Raquel Aparicio, PhD Candidate; Samantha López, PhD Candidate; Dr Carles Escera, Senior Staff.
There has always been a close relationship between art and humans. In Europe there are some claims that even Neanderthals were producing cave art about 70,000 years ago and anatomically modern humans definitely did so 40,000 years ago. In other parts of the world paintings also have very early dates (in Sulawesi, for example, some are at least 40,000 years old). The reason behind their creation and meaning is still beyond our understanding, as this would involve having knowledge of how our ancestors lived and experienced the world. However, in the Artsoundscapes project we have found a way to overcome these barriers and come closer to understanding some aspects of their production, at least in relation to the art of late hunter-gatherers and early agriculturalists in the Holocene. The way to we do this is through sound.
The aim of the Artsoundscapes project is to explain how acoustics played a role in the production of rock art paintings. Specifically, members of the project with backgrounds in archaeology and acoustical engineering are testing whether rock art landscapes have different acoustics compared to similar landscapes without rock art. This would indicate that premodern societies were considering soundscapes to produce these ancient paintings. But why would they? In the project, we believe that one potential answer is the emotional state that sounds produce in certain acoustic environments.
The Artsoundscapes project has research lines in psychoacoustics and neuroscience. In these we measure the psychological and physiological reactions of modern participants to the rock art soundscapes. Archaeologists tell us that these places were not for domestic use, but instead had a symbolic significance for the people who created and used them. Therefore, we aim to explore whether the psychological and physiological reaction to acoustics is similar to feelings and brain patterns related to transcendence and meditation. The limitation we face regarding the differences between premodern populations and today’s modern humans has already been discussed in a previous blog (https://www.ub.edu/artsoundscapes/measuring-emotions-to-understand-ancient-communities/). Here, we will tackle another endeavour within the project: how can we measure mental states with electroencephalography (EEG)?
Everything we think, do and refrain from doing is just an elaborate function of an electro-chemical nature computed by a complicated mass of the specialised cells, known as “neurons”, that make up our brain. When a stimulus reaches our sensory organs, the unique characteristics of that stimulus (for example, the pitch or loudness of a sound) are processed in multiple steps by many interconnected neurons. Specifically, at a microscopic level, the information from the external stimuli takes the form of electrically charged atoms (ions) and enters individual neurons from its dendrites to its cell body (Figure 1).
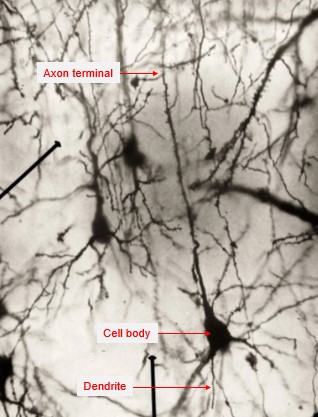
Figure 1. Image of a neuron and its main parts (adapted from Ramón y Cajal).
The entry of ions into the neurons produces an electrical change within their cell body. If this charge is strong enough, then an all-or-nothing phenomenon known as “action potential” occurs (Hodgkin & Huxley, 1952). An action potential is the transmission of an electrical impulse from the cell body through the axon of a neuron to its axon terminal. When an action potential is produced, molecules, known as neurotransmitters, are released outside the neuron. These neurotransmitters will come into contact with the dendrites of other neurons and potentially generate further action potentials in them. In this way, information is processed and passed from one neuron to the other.
What we end up consciously perceiving or feeling is believed to be represented by the interconnected and patterned activity of many neurons (Schneidman et al., 2011). Luckily for us – the neuroscientists – the macroscopic changes produced by this synchronised activity can be easily measured. We do this by placing electrodes (small conductive metal discs) on human scalps. This almost centennial and non-invasive technique to measure brain activity is known as an electroencephalogram (or EEG) (see Figure 2).
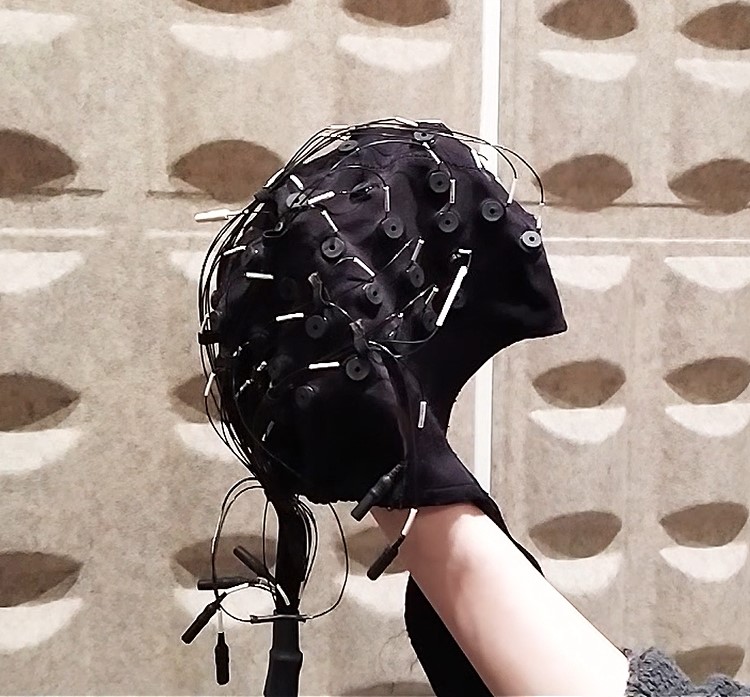
Figure 2. Electroencephalography cap from the Brainlab – Cognitive Neuroscience Research Group.
The macroscopic synchronised patterns we measure with the EEG take the form of oscillations due to the underlying microscopic dynamics of individual neurons (Jensen et al., 2014). Oscillations are very common in nature and can be found everywhere, from the up and down motion of small boats on the sea to the motion of the strings on musical instruments. Given any oscillation, you can always measure its frequency, which is the rate per second of a vibration that constitutes a wave (see Figure 3).
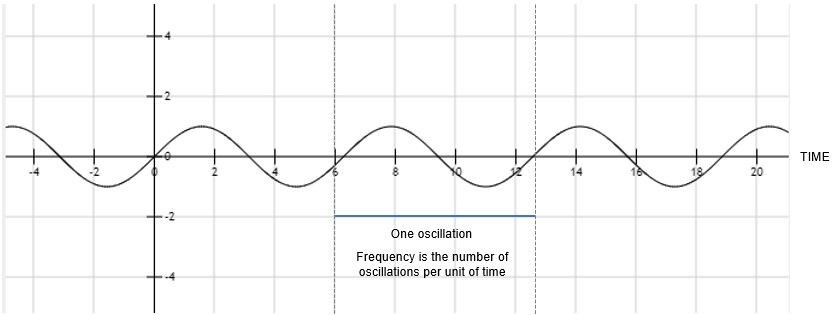
Figure 3. Oscillations and frequency calculation.
Therefore, one approach to analysing brain activity measured with EEG is to quantify the amount of oscillatory activity at different frequencies. This is known as spectral analysis. Using this technique and correlating the different frequencies to cognitive processes, neuroscientists have classified the many frequencies of electrical brain activity into delta, theta, alpha, beta and gamma (Jasper & Andrews, 1936) (see Table 1).
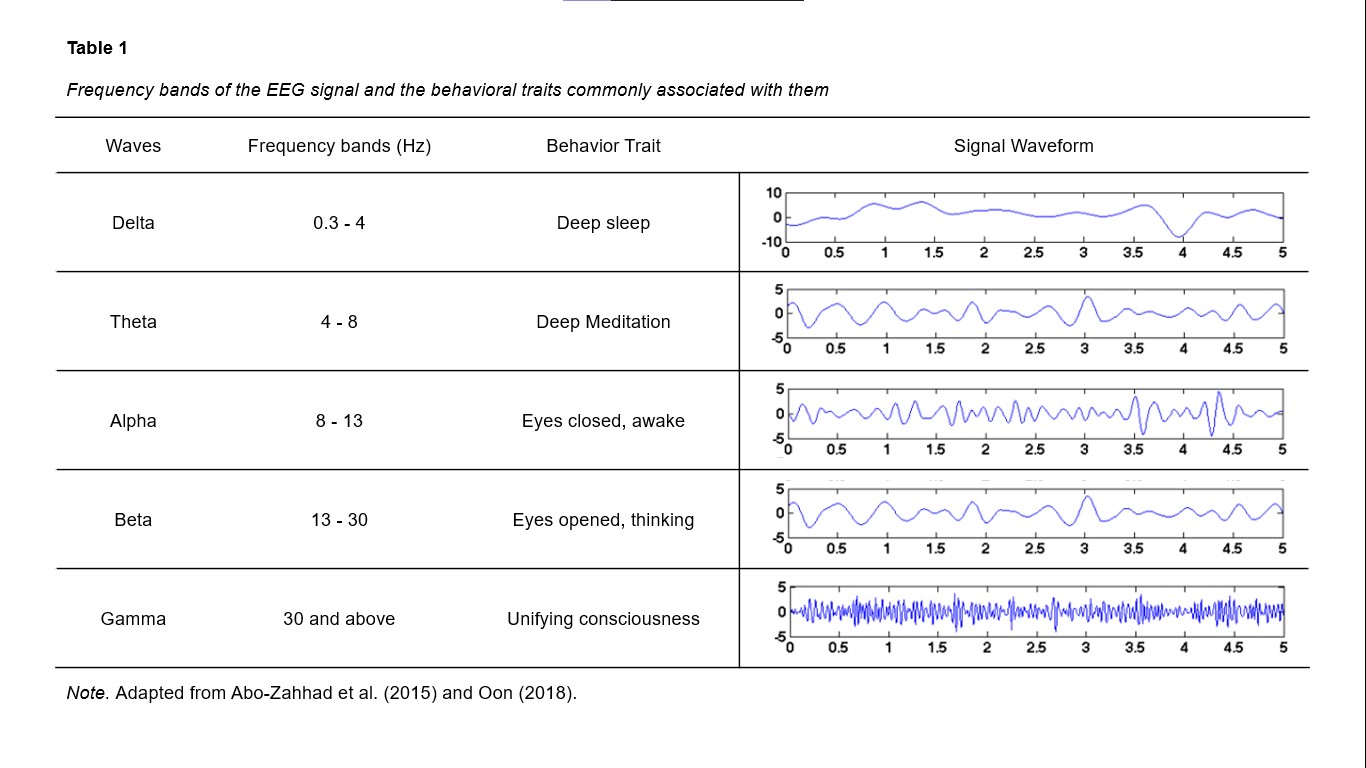
Table 1.
Different frequency bands can temporally coexist in the same or different brain structures. Their presence and combinations are closely linked to various brain states, such as the stages of sleep and the arousal levels of waking. Therefore, mental states can be characterised by different combinations of the EEG frequency bands. For example, a recent study (Jap et al., 2009) explored mental states while driving measured with EEG frequency bands. It found that fatigue while driving is associated with stable delta and theta activities over time, a slight decrease in alpha activity, and a significant decrease in beta activity.
Analysing the spectral features of the EEG is still a widespread practice in neuroscience. However, it only allows for the exploration of which frequency bands are modulated in the condition of interest (e.g. meditation) compared to a baseline condition (e.g. normal waking). This technique does not allow for an in-depth explanation of how specific auditory stimuli activate neural populations and produce a special human experience. At least, it does not explain it in the same way as a mechanical process can be understood. Therefore, reaching an understanding of the brain mechanisms underlying mental states often requires more sophisticated techniques.
A fundamental neural mechanism underlying brain function is the synchronisation in activity of different neuronal populations (Chawla et al., 1999). You can think of it this way: radio signals are broadcast at different frequencies so that listeners can tune into one particular frequency and listen to their preferred radio station. By aligning the frequency of emission and the frequency of reception, the machinery can ignore all the information that is not important at that moment and play only what we want to hear. In a similar manner, when two neural populations communicate with each other they do so by aligning the frequency of activity. There is only a small delay in the synchronisation depending on the direction of the communication (Fries, 2005; Fries et al., 2007; Fries et al., 2008). Based on this physiological behaviour, there has been increasing interest in measuring the synchronisation between brain signals. These measurements would help scientists understand how brain regions communicate with each other in different conditions (see Figure 4).
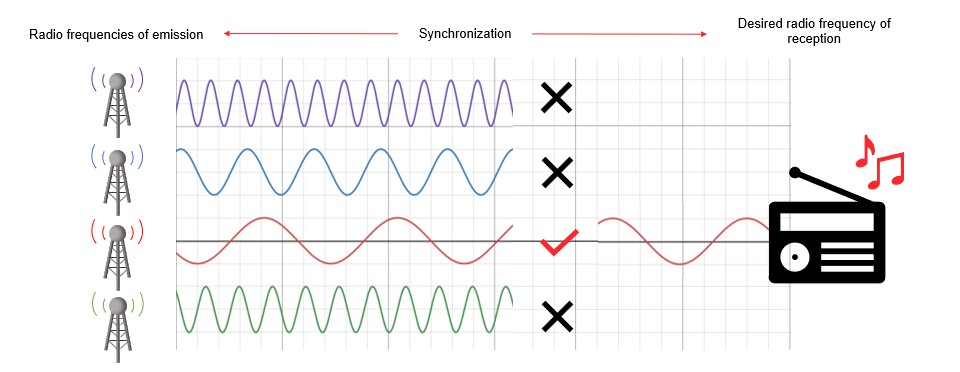
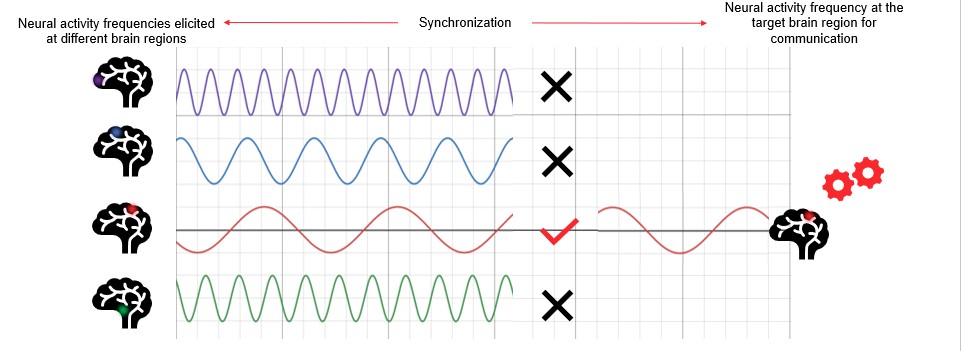
Figure 4. Brain and radio analogy. Brain areas communicating with one another synchronise their activity in frequency like a radio receiver.
The typical finding using EEG synchronisation analyses is that during a particular perceptual, cognitive or motor task the EEG synchrony measures either increase or decrease. This observation suaggests that different neural populations are aligning their activity to work in harmony for cognitive or behavioural performance. However, there is an important point to take into account for understanding the findings allowed by this analysis. As described above, EEG is recorded by placing electrodes distributed across the scalp. The electrical activity elicited by neurons has to travel from the brain to the electrodes on the scalp. On its way, this electrical activity has to pass through the head tissues and the skull, which has high resistivity. Moreover, neurons are not all optimally orientated towards the skull surface, so there are many signal cancellations and amplifications from various parts of the brain. Therefore, EEG lacks good spatial resolution and it is difficult to know exactly where the recorded activity is originating from within the brain, a difficulty known as the “inverse problem” (Balish & Muratore, 1990) (see Figure 5).
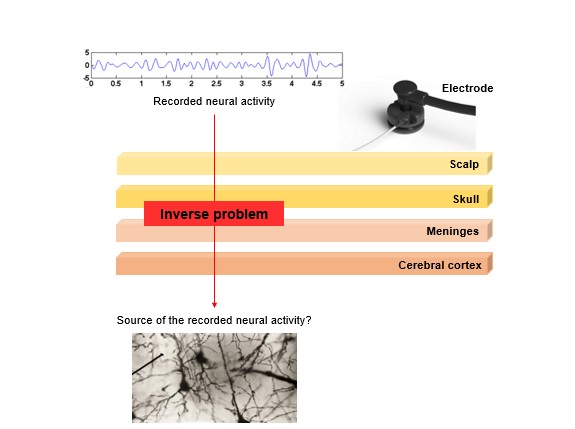
Figure 5. When trying to infer the source of the neural activity recorded with electroencephalography we face the inverse problem.
Due to advances in technology, a solution has been found to the EEG inverse problem and we can now estimate where signals are generated in the brain. This estimation is made by using head models and localising where the EEG signal generators are. Consequently, EEG synchronisation can be obtained mainly in two ways (see Figure 6). One is by calculating the synchronisation between the scalp electrodes, without the requirement to solve the inverse problem. The other is by working out the synchronisation of estimated activity sources. This can be done with standardised inverse solution methods (such as low-resolution brain electromagnetic tomography – sLORETA – and exact low resolution brain electromagnetic tomography – eLORETA –). Using one type of analysis or the other will allow for different depths of abstraction.
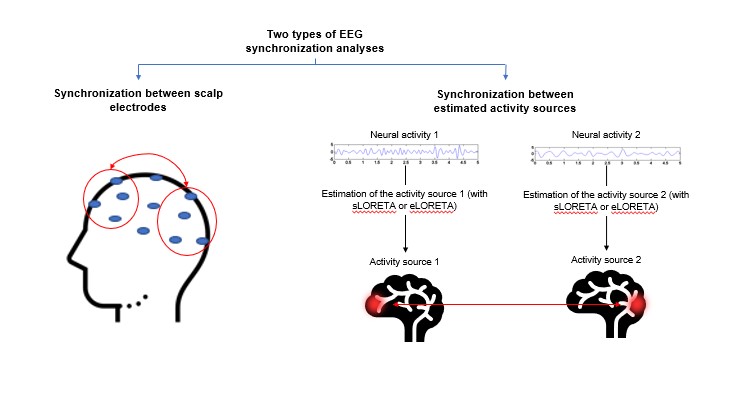
Figure 6. The two main electroencephalography (EEG) synchronisation analyses used to characterise mental states.
One example in which the neural correlates of a mental state were characterised by measuring the synchronisation between scalp electrodes is the work conducted by Abraham and Duffy in 2001. They wanted to explore the chronic visual hallucinations that some people get after the consumption of lysergic acid diethylamide (LSD). To do so, they used measurements of coherence between local and medium distance scalp electrodes. The results showed that people with chronic visual hallucinations who kept their eyes open showed a widespread reduction in coherence. However, with their eyes closed the same group showed augmented regional coherence in the occipital region (a large brain area that is known to be modulated by visual activity). The authors suggested that when closing one’s eyes, the increased local hypersynchrony may facilitate hallucinatory experiences.
Kometer et al. (2015) used eLORETA to explore the hallucinatory experience produced by psilocybin, also known as “magic mushrooms”. This substance has been associated with an increase in the delay of synchronisation. It has also been linked to a decrease in the theta and alpha oscillations in brain areas that strongly overlap with the default mode network (DMN). The DMN is a collection of brain regions that is apparently inactive during any specific cognitive function. It has been associated with altered states of consciousness induced by anaesthetics (Boly et al., 2008) or meditation (Brewer et al., 2011), among others. The DMN has also been implicated in self-referential processing (Gusnard et al., 2011) (self-referential processing is the cognitive process of relating information, often from the external world, to the self). Therefore the authors suggest that the disruption of normal processing in the DMN may alter self-referential processes and lead to alterations in the state of consciousness. As seen in these two examples, both techniques – i.e. coherence between scalp electrodes and eLORETA – are useful for explaining, to a greater or lesser extent, the neural processes that mediate the mental states produced by the consumption of external substances.
Three main techniques for measuring mental states with EEG are described above: measurement of EEG frequency bands, measurement of synchronisation between scalp electrodes (e.g. scalp EEG coherence) and measurement of synchronisation between estimated signal generators (e.g. eLORETA intracortical coherence). Although they differ in terms of complexity, they have all been used efficiently to characterise or explain the neuroscience behind various mental states. Investigating modulations in the EEG frequency bands is mainly descriptive and can only be used to differentiate or look for similarities between neural signatures of mental states. However, exploring the synchronisation between estimated signal generators can give us a deeper insight into how human experience is created beginning with simple electrical signals. The use of one technique or another will always depend on the research question at hand.
Coming soon in Research Line 3 of the Artsoundscapes project, we will use the techniques described here, among others, to investigate how rock art soundscapes might modulate mental states. The result of our work will be a phenomenological understanding of the role of acoustics in the production of rock art.
References
- Abo-Zahhad, M., Ahmed, S., & Seha, S. N. (2015). A new EEG acquisition protocol for biometric identification using eye blinking signals. International Journal of Intelligent Systems Technologies and Applications, 7(06), 48-54. https://doi.org/10.5815/ijisa.2015.06.05
- Abraham, H. D., & Duffy, F. H. (2001). EEG coherence in post-LSD visual hallucinations. Psychiatry Research, 107(3), 151-163. https://doi.org/10.1016/S0925-4927(01)00098-1
- Balish, M., & Muratore, R. (1990). The inverse problem in electroencephalography and magnetoencephalography. Advances in Neurology, 54, 79-88.
- Boly, M., Phillips, C., Tshibanda, L., Vanhaudenhuyse, A., Schabus, M., Dang-Vu, T. T., Moonen, G., Hustinx, R., Maquest, P., Laureys, S. (2008). Intrinsic brain activity in altered states of consciousness: how conscious is the default mode of brain function? Annals of the New York Academy of Sciences, 119-129. https://doi.org/10.1196/annals.1417.015
- Brewer, J. A., Worhunsky, P. D., Gray, J. R., Tang, Y. Y., Weber, J., Kober, H. (2011). Meditation experience is associated with differences in default mode network activity and connectivity. Proceedings of the National Academy of Sciences of the United States of America, 108(50), 20254-20259. https://doi.org/10.1073/pnas.1112029108
- Chawla, D., Lumer, E., & Friston, K. (1999). The Relationship Between Synchronization Among Neuronal Populations and Their Mean Activity Levels. Neural Computation, 11(6), 1389-1411. https://doi.org/10.1162/089976699300016287
- French, C. C., & Beaumont, J. G. (1984). A critical review of EEG coherence studies of hemisphere function. Frontiers in Systems Neuroscience, 1(3), 241-254. https://doi.org/10.3389/fnsys.2020.00053
- Fries, P. (2005). A mechanism for cognitive dynamics: neuronal communication through neuronal coherence. Trends in Cognitive Sciences, 9(10), 474-480. https://doi.org/10.1016/j.tics.2005.08.011
- Fries, P., Nikolić, D., & Singer, W. (2007). The gamma cycle. Trends in Neurosciences, 30(7), 309-316. https://doi.org/10.1016/j.tins.2007.05.005
- Fries, P., Womelsdorf, T., Oostenveld, R., & Desimone, R. (2008). The effects of visual stimulation and selective visual attention on rhythmic neuronal synchronization in macaque area V4. Journal of Neuroscience, 28(18), 4823-4835. https://doi.org/10.1523/JNEUROSCI.4499-07.2008
- Gusnard, D., Akbudak, E., Shulman, G. L., & Raichle, M. (2001). Medial prefrontal cortex and self-referential mental activity: relation to a default mode of brain function. Proceedings of the National Academy of Sciences, 98(7), 4259-4264. https://doi.org/10.1073/pnas.071043098
- Hodgkin, A. L., & Huxley, A. F. A. (1952). A quantitative description of membrane current and its application to conduction and excitation in nerve. The Journal of Physiology, 117(4), 500-544. https://doi.org/10.1113/jphysiol.1952.sp004764
- Jab, B. T., Lal, S., Fischer, P., & Bekiaris, E. (2009). Using eeg spectral components to assess algorithms for detecting fatigue. Expert Systems with Applications, 36(2), 2352-2359. https://doi.org/10.1016/j.eswa.2007.12.043
- Jasper, H. H., & Andrews, H. L. (1936). Human Brain Rhythms: I. Recording Techniques and Preliminary Results. The Journal of General Psychology, 98-126. https://doi.org/10.1080/00221309.1936.9713141
- Jensen, O., Spaak, E., & Zumer, J. (2014). Human Brain Oscillations: From Physiological Mechanisms to Analysis and Cognition. In S. Super & C. J. Aine (Eds.), Magnetoencephalography (pp. 359-403). Springer. https://doi.org/10.1007/978-3-642-33045-2_17
- Kometer, M., Pokorny, T., Seifritz, E., & Vollenweider, F. (2015). Psilocybin-induced spiritual experiences and insightfulness are associated with synchronization of neuronal oscillations. Psychopharmacology, 232(19), 3663-3676. https://doi.org/10.1007/s00213-015-4026-7
- Oon, H. N., Saidatul, A., & Ibrahim, Z. (2018). Analysis on non-linear features of electroencephalogram (EEG) signal for neuromarketing application. International Conference on Computational Approach in Smart Systems Design and Applications (ICASSDA). https://doi.org/ 10.1109/ICASSDA.2018.8477618
- Schneidman, E., Puchalla, J. L., Segez, R., Harris, R., a., Bialek, W., & Berry II, M. J. (2011). Synergy from silence in a combinatorial neural code. Journal of Neuroscience, 31(44), 15732-15741.
- Schneidman, E., Puchalla, J. L., Segev, R., Harris, R. a., Bialek, W., & Berry II, M.J. (2011). Synergy from silence in a combinatorial neural code. Journal of Neuro-science, 31(44), 15732–15741. https://doi.org/10.1523/JNEUROSCI.0301-09.2011
