Active Nematics
Jyo Nambisan, Alexis de la Cotte, Javier Rojo-González
Nematics are generally composed of rod-like molecules that prefer to align with their long axes in the same direction. We use the director n to describe this local average orientation of a group of molecules, as seen schematically in Figure 1A. Places in the nematic where n is undefined are called defects, as shown schematically by the colored dots on the director diagrams in Figure 1B. Defects are characterized by their topological charge, s, which is calculated using the director rotation along a closed path encircling the defect. For example, n rotates by π along the red path in Figure 2B, giving s = +1/2, and n rotates by –π along the blue path in Figure 2B, giving s = -1/2. The nematic system in this work is detailed schematically in Figure 1C. The individual rod-like units are microtubules. The activity comes from kinesin clusters that consume ATP and drive the microtubules to slide along each other. In this way the system has its own source of internal energy and will never come to rest. The addition of PEG to the system causes the microtubules to deplete to each other and bundle together to form fibers. The depletion then drives these bundles to an interface to form a 2D nematic. The microtubules are fluorescently labeled, so we image to active nematic using fluorescent and confocal fluorescent microscopy. An example image with an s =+1/2 and s =-1/2 defect highlighted is shown in Figure 1D.
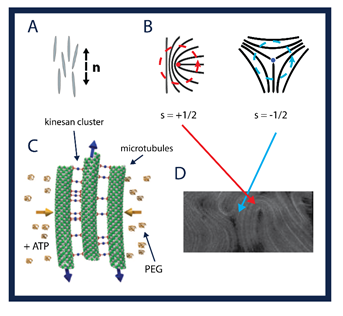
Figure 1: (A), schematic demonstrating the director as a local average of the orientation of the NLC molecules. (B), director schematics of a +1/2 defect and a -1/2 defect. (C), the active nematic system. The fluorescently-labeled microtubules are the "molecules of the active nematic. The activity comes from the kinesan clusters that consume ATP and cause the microtubules to slide by each other, as indicated by the blue arrows. The PEG acts a depletant, causing the microtubules to bundle together, as indicated by he yellow arrows. (D) A fluorescence image of an active nematic with a +1/2 and -1/2 defect indicated with the respective arrows.
We put the active nematic on the surface of a toroid to explore the relationship between the Gaussian curvature, K, and the defects. Theory and experiments [1] predicts that the defects couple to K with s>0 defects attracted to regions of K and s < 0 defects attracted to regions with K< 0. Toroids have positive K on the outside of the handle and negative K on the inside of the handle, as illustrated in Figure 2A. We characterize our toroids by their aspect ratio, ξ = R_0/a, as defined schematically in Figure 2B.
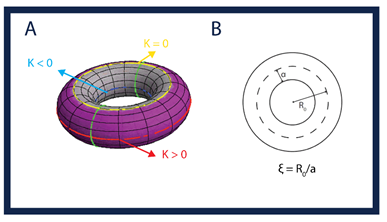
Figure 2: (A), schematic of a torus with the region of positive Gaussian curvature, K, in purple, the region of negative K in gray, and the K = 0 line in yellow. The red line and the purple line represent the contours of maximum and minimum K, respectively. (B), top-down drawing of a torus defining the central circle radius, R_0, the tube radius a, and the aspect ratio ξ = R_0/a.
Experiments performed in our group have highlighted two features of defects in active nematics. First, when placed on the surface of a torus, we confirm that defects unbinding
occurs with defects being attracted to regions of like-signed curvature. Then, simulations and experiments [2] in flat space highlighted short-range orientational correlation
of +1/2 defects, without global order or preference in orientation, that can be collapsed to a unique curve by rescaling the distance with the mean defect spacing.
Our research now focuses on studying the interplay between surface curvature and the orientation of the defects. To access regions of higher curvature, we generate active
nematic tori that are tilted (Figure 3), and we can then bin the torus and gather the orientation of defects, mapped in toroidal coordinates (see Figure 3), in three areas of
interest: regions of curvature K close to 0 (analogous to flat space), regions of highly positive K, and regions of highly negative K.
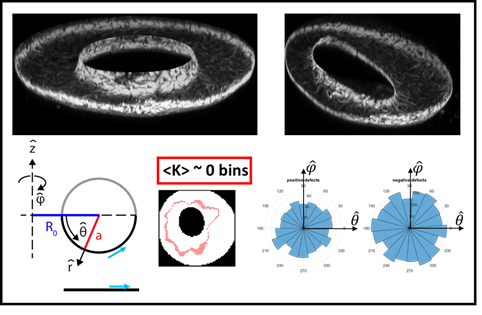
Figure 3: Top: Confocal stack of an active nematic on the surface of a torus. Reconstruction on the left is an example of a tilted torus, that gives us access to regions of higher curvature. Bottom: Schematics illustrating the toroidal coordinates used to map the orientations of the defects. The results shown on the left highlight the location of the bins with curvature close to 0 (analogous to flat space) on the surface of the torus, as well as the orientation of the +1/2 defects (left histogram) and -1/2 defects (right histogram).
We first look at the regions of K close to 0, and find similar results than what we obtained in flat space: the histograms show no preferential orientations of the defects (Figure 3). However, when we move to highly curved regions, positive or negative, we find that this time, defects show a preferred orientation, as shown in the histograms in Figure 4. The preferred orientation of defects in K > 0 areas is symmetrically opposed to the ones in K < 0 areas, as it is best exemplified by the orientation of +1/2 defects being along –θ in positively curved bins, and along +θ in negatively curved bins. We also find an increase in polar order with curvature, highlighting again the rise of a global order in the orientation of defects with curvature.
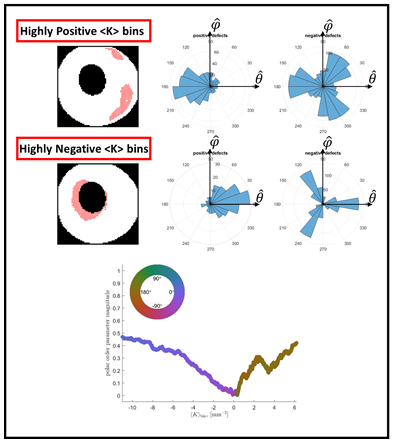
Figure 4: Histogram of the orientation of defects in positively curved and negatively curved bins. The bottom graph shows the evolution of the polar order of +1/2 defects as a function of curvature, highlighting the rise in order with K.
[1] P. W. Ellis, D. J. G. Pearce, Y-W. Chang, G. Goldsztein, L. Giomi, A. Fernandez-Nieves, Nature Physics 14, 85 (2018).
[2] D. J. G. Pearce, J. Nambisan, P. W. Ellis, A. Fernandez-Nieves, L. Giomi, PRL 127, 197801 (2021).