PI: Carles Escera
Seminal studies back to the seventies and eighties of the last century have suggested the Frequency-Following Response (FFR) to originate from neuronal aggregates in caudal brainstem and midbrain auditory nuclei. However, the single MEG study conducted so far to address the sources of the FFR challenged this assumption by disclosing a major cortical contribution when the eliciting sound was a speech token whose fundamental frequency was close to 100 Hz (Coffey et al., 2016). Capitalizing on the phase-locking capabilities of subcortical compared to cortical neuronal assemblies (Joris et al., 2004), we are currently aiming to resolve midbrain, thalamic and cortical contributions to the FFR with a double approach.

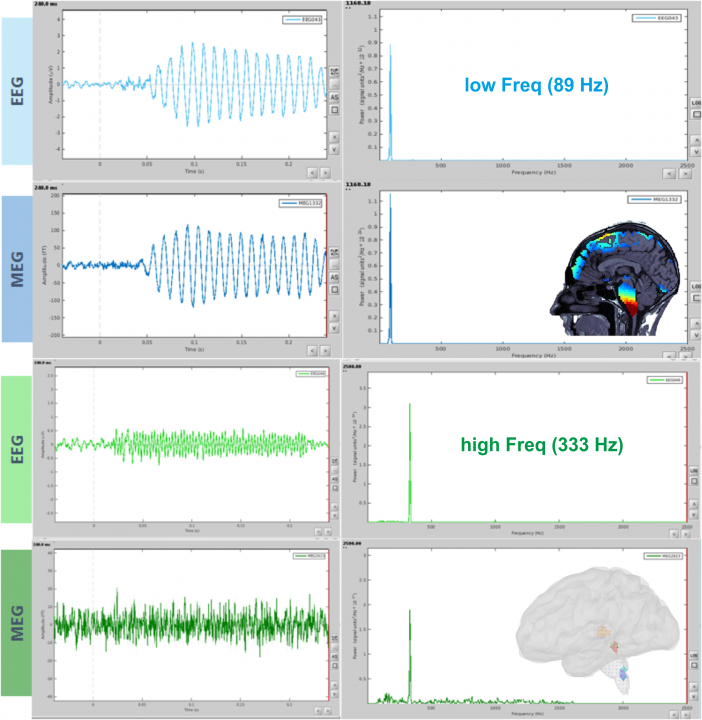
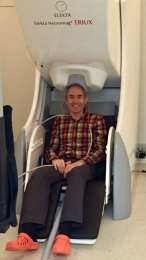
First, in collaboration with Dr. Piia Astikainen of University of Jyväskylä (Finland), we run a combined EEG/MEG experiment to record FFRs elicited to low (89 Hz) and high (333 Hz) pure tones, under the hypothesis that high frequency tones would recruit much less or null cortical contribution.
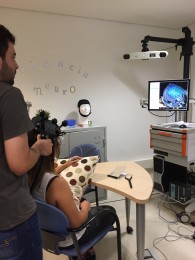
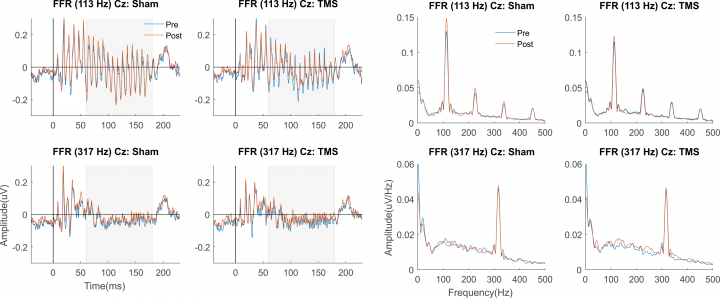
Second, in collaboration with Dr. David Bartrés-Faz, at the Barcelona Brain Stimulation Lab (BBSLAB) of University of Barcelona, we are inhibiting auditory cortex by means of Transcranial Magnetic Stimulation (TMS) to test the hypothesis that FFRs elicited to high (317 Hz) compared to low (113 Hz) fundamental frequency speech syllables would not be distorted, thus disclosing a direct role of auditory cortex in FFR generation to low frequency stimuli.

Figure 1. MEG recordings of the Frequency-Following Response (FFR) to low (89 Hz) and high (333 Hz) pure tones. Notice that these are individual responses after the average of a rough 15000 tone repetitions recorded at 10000 Hz sampling rate over 220 MEG channels. Data from Gorina-Careta et al. (in preparation).

 Figure 2. Grand-average (N=18) Frequency-Following Responses (FFRs) to a consonant-vowel syllable /ba/ of low (113 Hz) and high (317) Hz fundamental frequency obtained in baseline (Pre-) and Post- TMS and Sham (control) sessions (left panel). The right panel shows the corresponding spectra. Data from López-Caballero et al. (in preparation).


