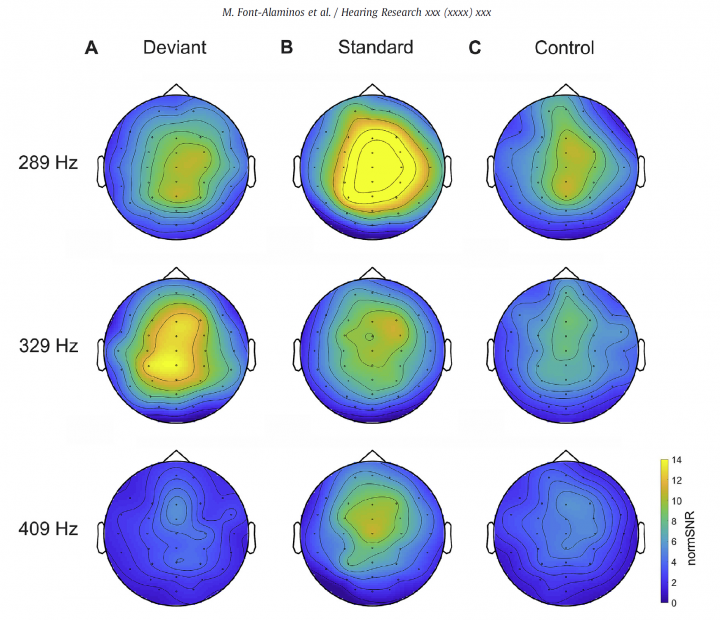
Figure 6 of our paper by Font-Alaminos and colleagues (see our former post here) was selected for the cover of the special issue entitled Stimulus-specific adaptation, MMN and predicting coding, edited by R. Auksztulewicz and M.S. Malmierca in Hearing Research.

The Figure illustrates the frequency-following response (FFR) scalp distributions of the A) deviant B) standard and C) control conditions for stimuli of different frequencies arranged in oddball, reversed-oddball and control sequences.. To obtain the FFR scalp distributions, epoched and cleaned data for each condition, frequency and subject separately was imported to Fieldtrip (Oostenveld et al., 2011). Fast Fourier Transform (FFT) was applied to demeaned, zero-padded (1-Hz resolution) averages, windowed with a Hanning tapper within the 10e240 ms time-period and spectral amplitudes were averaged across subjects for each condition and frequency separately. Normalized power spectrums were then computed for each grand-average by normalizing the whole spectrum by the noise floor of the frequency of interest (289, 329 or 409 Hz), considered to be the mean of a 20 Hz window in each side of the frequency of interest leaving a 10-Hz-space from the frequency peak. The mean normalized spectral response was computed using a 20-Hz-wide window surrounding each of the tone frequencies and plotted for each electrode in a scalp topography for each type of stimulus and each tone frequency separately.
Reference:
Font-Alaminos, M., Ribas-Prats, T., Gorina-Careta, N., & Escera, C. (2020). Emergence of prediction error along the human auditory hierarchy. Hearing Research, in press.
Permanent doi: https://doi.org/10.1016/j.heares.2020.107954.

